Python front-end (pyfabm)
FABM comes with a pyfabm package for the python programming language.
This package enables you to access
FABM’s biogeochemical models directly
from python. For instance, you can enumerate a model’s parameters and variables,
or obtain temporal derivatives and diagnostics for any given environment and
model state. In combination with a python-based time integration scheme
(e.g., scipy.integrate.odeint), this also allows you to perform model
simulations. More information about pyfabm can be found on the
FABM wiki page.
Below you can find brief instructions on how to use pyfabm with ERSEM.
Running pyfabm tutorial
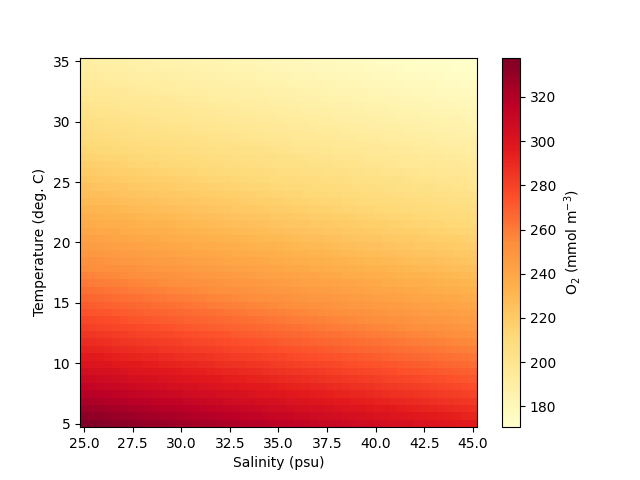
To demonstrate how pyfabm can be used with ERSEM, we will calculate the
oxygen saturation concentration as a function of temperature and salinity
using the method implemented in ERSEM, which is taken from [3].
Note
The following script requires matplotlib to be installed. This can
easily be done via pip in the following way:
python -m pip install matplotlib
With pyfabm installed, this can be achieved using the following code:
  1import matplotlib.pylab as plt
  2import numpy as np
  3import os
  4import pyfabm
  5import yaml
  6import tempfile
  7
  8def main():
  9    """
 10    Run pyfabm-ERSEM tutorial
 11
 12    :param model_path: Full path to netCDF model output
 13    :type model_path: str
 14
 15    :return: list of oxygen saturation concentrations
 16    :rtype: list
 17    """
 18    dir_path = os.path.dirname(os.path.realpath(__file__))
 19    ersem_dir = os.path.dirname(os.path.dirname(dir_path))
 20
 21    # Path to ERSEM yaml file
 22    ersem_yaml_file = os.path.join(ersem_dir,
 23                                   'testcases',
 24                                   'fabm-ersem-26.02-dvm.yaml')
 25
 26    if not os.path.isfile(ersem_yaml_file):
 27        raise RuntimeError("Could not find Ersem yaml file with the "
 28                           "{}".format(ersem_yaml_file))
 29
 30
 31    # Removing DVM from pyfabm tests
 32    with open(ersem_yaml_file) as f:
 33        raw = f.read()
 34
 35    data = yaml.safe_load(raw.replace('\t', '  '))
 36    del data["instances"]["dm"]
 37    del data["instances"]["dw"]
 38    del data["instances"]["db"]
 39
 40    with tempfile.NamedTemporaryFile(mode="w", suffix=".yaml", delete=False) as tmp:
 41        yaml.safe_dump(data, tmp, sort_keys=False)
 42        temp_path = tmp.name
 43
 44    # Create model
 45    model = pyfabm.Model(temp_path)
 46
 47    # Configure the environment
 48    model.findDependency('longitude').value = -4.15
 49    model.findDependency('latitude').value = 50.25
 50    model.findDependency('number_of_days_since_start_of_the_year').value = 0.
 51    model.findDependency('temperature').value = 10.
 52    model.findDependency('wind_speed').value = 1.
 53    model.findDependency('surface_downwelling_shortwave_flux').value = 50.
 54    model.findDependency('practical_salinity').value = 35.
 55    model.findDependency('pressure').value = 10.
 56    model.findDependency('density').value = 1035.
 57    model.findDependency('mole_fraction_of_carbon_dioxide_in_air').value = 280.
 58    model.findDependency('absorption_of_silt').value = 0.07
 59    model.findDependency('bottom_stress').value = 0.
 60    model.findDependency('cell_thickness').value = 1.
 61    model.setCellThickness(1)
 62
 63    # Verify the model is ready to be used
 64    assert model.checkReady(), 'One or more model dependencies have not been fulfilled.'
 65
 66    # Define ranges over which temperature and salinity will be varied
 67    n_points = 50
 68    temperature_array = np.linspace(5, 35, n_points)
 69    salinity_array = np.linspace(25, 45, n_points)
 70
 71    # Create an array in which to store oxygen_saturation_concentrations
 72    oxygen_saturation_concentration = np.empty((n_points, n_points), dtype=float)
 73
 74    # Calculate oxygen saturation concentrations using ERSEM
 75    for t_idx, t in enumerate(temperature_array):
 76        model.findDependency('temperature').value = t
 77        for s_idx, s in enumerate(salinity_array):
 78            model.findDependency('practical_salinity').value = s
 79            _ = model.getRates()
 80            oxygen_saturation_concentration[t_idx, s_idx] = \
 81                    model.findDiagnosticVariable('O2/osat').value
 82
 83    # Create the figure
 84    figure = plt.figure()
 85    axes = plt.gca()
 86
 87    # Set color map
 88    cmap = plt.colormaps.get_cmap('YlOrRd')
 89
 90    # Plot
 91    plot = axes.pcolormesh(salinity_array,
 92                           temperature_array,
 93                           oxygen_saturation_concentration,
 94                           shading='auto',
 95                           cmap=cmap)
 96
 97    axes.set_xlabel('Salinity (psu)')
 98    axes.set_ylabel('Temperature (deg. C)')
 99
100
101
102    # Add colour bar
103    cbar = figure.colorbar(plot)
104    cbar.set_label('O$_{2}$ (mmol m$^{-3}$)')
105
106    plt.show()
107
108    return oxygen_saturation_concentration
109
110if __name__ == "__main__":
111    main()
In additions, example Jupyter notebooks that use the Python front-end can
be found in <FABMDIR>/testcases/python and more examples can be found
on the FABM wiki.