fabm0d: ERSEM in an aquarium
FABM’s 0d driver allows you to run biogeochemical models in a “well-mixed box” under arbitrary (time-varying) environmental forcing.
Running FABM0d tutorial
To run the model, you must first obtain or generate a set of input or forcing files. Setups for the L4 site are stored under version control and can be accessed here.
To run the tutorial, you will first need to clone the configuration files and then run FABM0d. This is done with the following:
1#!/bin/bash
2
3echo "Cloning config repo"
4git clone https://github.com/pmlmodelling/ersem-setups.git
5
6cd ersem-setups/0d-aquarium
7
8echo "Running FABM with repo configuration"
9~/local/fabm/0d/bin/fabm0d -y ../../ersem/testcases/fabm-ersem-26.02-dvm.yaml
Note
The following script requires matplotlib, netCDF and numpy to be
installed. This can easily be done via pip in the following way:
python -m pip install matplotlib numpy netCDF
To visualise the results, we again use a python script. Running the script you will need
to add a commandline argument --model-path which is the path to the output from
the FABM0d run.
1import argparse
2import matplotlib.pylab as plt
3from matplotlib import ticker
4import numpy as np
5import datetime
6import re
7import sys
8
9
10try:
11 import netCDF4 as nc
12except ImportError:
13 print("Please install the Python interface to netCDF")
14 sys.exit()
15
16
17def main(model_path):
18 """
19 Run FABM0D-ERSEM tutorial
20
21 :param model_path: Full path to netCDF model output
22 :type model_path: str
23
24 :return: Dictionary containing output model variables for systests
25 :rtype: dict
26 """
27 # Dictionary used to save input and output variables for testing
28 test_vars = {}
29 def plot_var(axes, x, y, label):
30 # sets the maximum number of labels on the x axis to be 10
31 xticks = ticker.MaxNLocator(10)
32
33 var = data.variables[label]
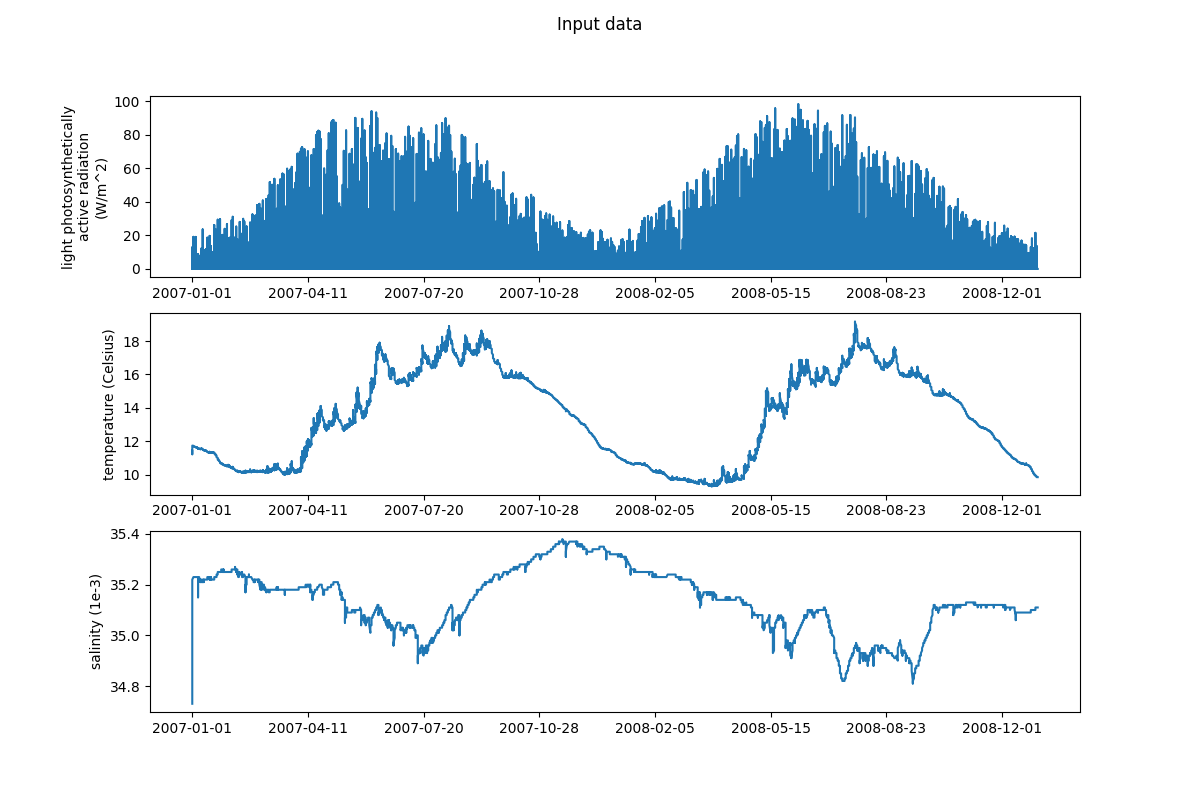
34 y = var[:].squeeze()
35
36 long_label = '{} ({})'.format(var.long_name, var.units)
37 y_label = re.sub(r'(\s\S*?)\s', r'\1\n',long_label)
38
39 axes.plot(x, y)
40 axes.set_ylabel(y_label)
41 axes.xaxis.set_major_locator(xticks)
42 test_vars[label] = y
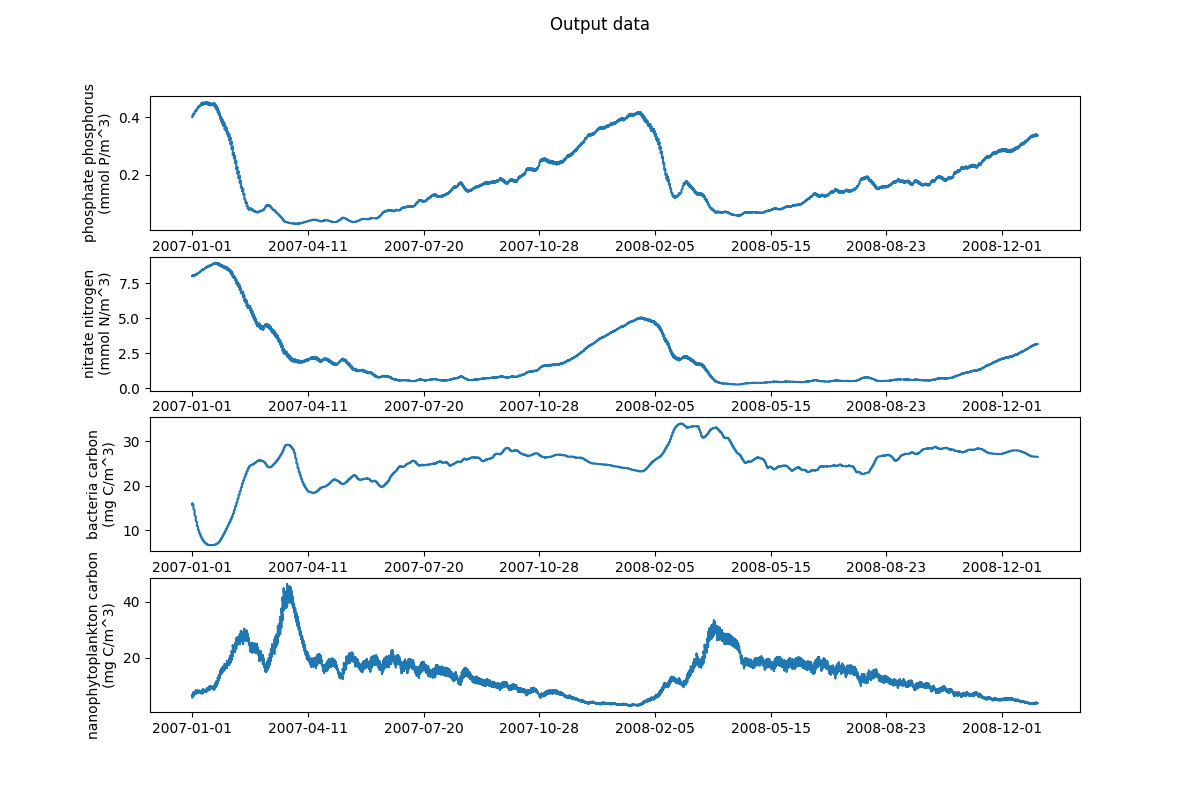
43
44
45 data = nc.Dataset(model_path, 'r')
46
47 times = data.variables['time']
48 dates = nc.num2date(times[:],
49 units=times.units,
50 calendar=times.calendar)
51 dates = [str(d).split(" ")[0] for d in dates]
52 test_vars["dates"] = dates
53
54 # Plotting input data
55 input_data = ["light_parEIR", "temp", "salt"]
56 fig, ax_arr = plt.subplots(len(input_data), 1)
57 DPI = fig.get_dpi()
58 fig.set_size_inches(1200.0/float(DPI),800.0/float(DPI))
59 for ax, label in zip(ax_arr, input_data):
60 plot_var(ax, dates, data, label)
61 fig.suptitle("Input data")
62
63 # Plotting output data
64 output_data = ["N1_p", "N3_n", "B1_c", "P2_c"]
65 fig, ax_arr = plt.subplots(len(output_data), 1)
66 DPI = fig.get_dpi()
67 fig.set_size_inches(1200.0/float(DPI),800.0/float(DPI))
68 for ax, label in zip(ax_arr, output_data):
69 plot_var(ax, dates, data, label)
70 fig.suptitle("Output data")
71 print(test_vars.keys())
72 plt.show()
73
74 return test_vars
75
76if __name__ == "__main__":
77
78 parser = argparse.ArgumentParser()
79 parser.add_argument('-p', '--model-path', type=str, required=True,
80 help='Path to FABM0D-ERSEM output')
81 args, _ = parser.parse_known_args()
82 model_path = args.model_path
83
84 main(model_path)