GOTM: ERSEM in a water column
To run the model, you must first obtain or generate a set of input or forcing files. Setups for the L4 and BATS sites which were used in [2] are stored under version control and can be accessed here. Forcing data for the SSB sampling sites can be accessed here. The following example uses the L4 setup described in [2].
Running GOTM-FABM-ERSEM
The L4 sampling site is one part of the Western Channel Observatory (WCO), and is located at (50°15.0’N; 4°13.0’W).
To run the tutorial, you will first need to clone the configuration files and then run gotm. This is done with the following:
1#!/bin/bash
2
3echo "Cloning config repo"
4git clone https://github.com/pmlmodelling/ersem-setups.git
5
6cd ersem-setups/L4
7
8echo "Running GOTM with repo configuration"
9~/local/gotm/bin/gotm
Note
The following script requires matplotlib, netCDF4 and numpy to be
installed. This can easily be done via pip in the following way:
python -m pip install matplotlib numpy netCDF4
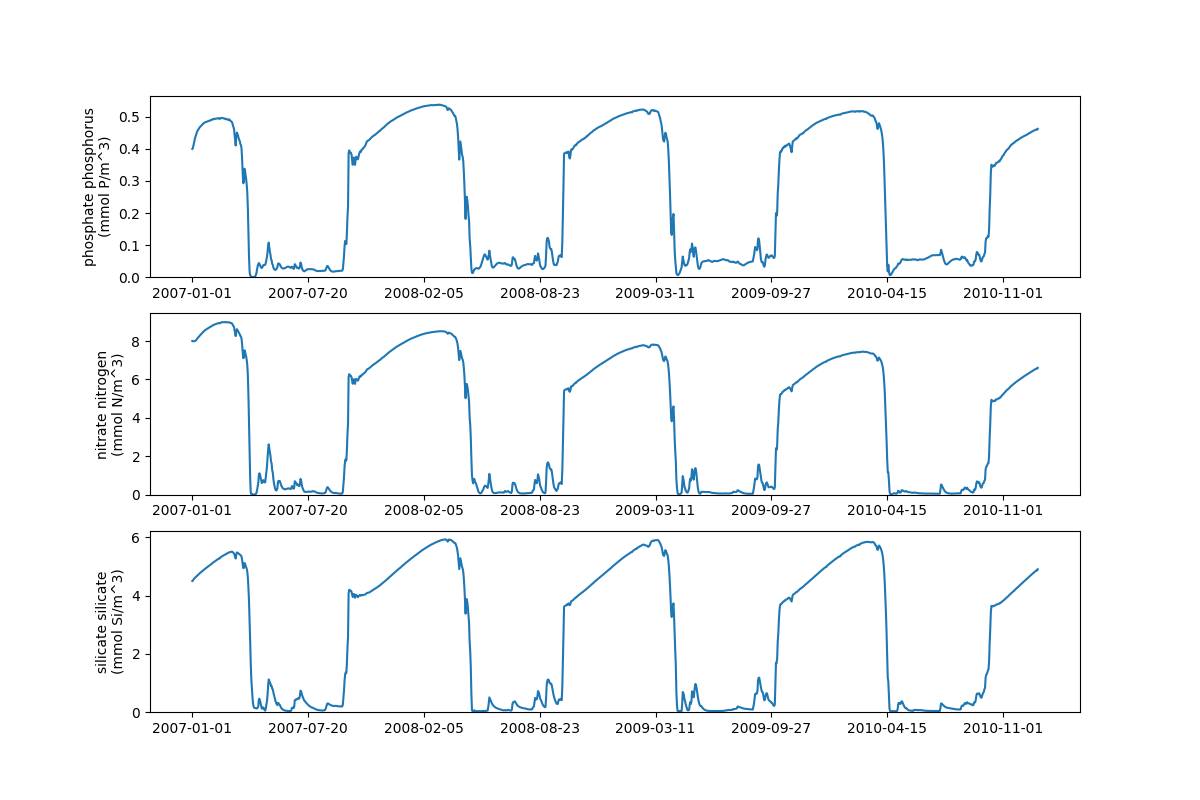
To visualise the results, we again use a python script. Running the script you will need
to add a commandline argument --model-path which is the path to the output from
the GOTM-FABM-ERSEM run.
 1import argparse
 2import matplotlib.pyplot as plt
 3from matplotlib import ticker
 4import numpy as np
 5import os
 6import sys
 7import re
 8
 9try:
10    import netCDF4 as nc
11except ImportError:
12    print("Please install the Python interface to netCDF")
13    sys.exit()
14
15
16def main(model_path):
17    """
18    Run GOTM-ERSEM tutorial
19
20    :param model_path: Full path to netCDF model output
21    :type model_path: str
22
23    :return: Dictionary containing output model variables for systests
24    :rtype: dict
25    """
26
27    # Dictionary used to save output variables for testing
28    output_vars = {}
29    def plot_time_series(axes, data, depth, model_var_name):
30        # sets the maximum number of labels on the x axis to be 10
31        xticks = ticker.MaxNLocator(10)
32
33        times = data.variables['time']
34        dates = nc.num2date(times[:],
35                            units=times.units,
36                            calendar=times.calendar)
37
38        z = data.variables['z'][:].squeeze()
39        zi = data.variables['zi'][:].squeeze()
40        var = data.variables[model_var_name]
41
42        long_label = '{} ({})'.format(var.long_name, var.units)
43        y_label = re.sub(r'(\s\S*?)\s', r'\1\n',long_label)
44
45        # Interpolate variable data to the given depth below the moving free surface
46        var_time_series = []
47        for i in range(var.shape[0]):
48            # Remove offset introduced by the moving free surface
49            depth_offset = depth + zi[i, -1]
50
51            var_time_series.append(np.interp(depth_offset, z[i, :], var[i, :].squeeze()))
52
53        dates = [str(d).split(" ")[0] for d in dates]
54        axes.plot(dates, var_time_series)
55        axes.set_ylabel(y_label)
56        axes.xaxis.set_major_locator(xticks)
57        output_vars[model_var_name] = var_time_series
58        output_vars['dates'] = dates
59
60    data = nc.Dataset(model_path, 'r')
61    data.set_auto_maskandscale(True)
62
63    # Depth at which to compare the model and data, given as relative to the moving free surface.
64    depth = 0.0
65
66    fig, ax_arr = plt.subplots(3,1)
67    DPI = fig.get_dpi()
68    fig.set_size_inches(1200.0/float(DPI),800.0/float(DPI))
69
70    names = ['N1_p', 'N3_n', 'N5_s']
71    for ax, name in zip(ax_arr, names):
72        plot_time_series(ax, data, depth, name)
73
74        ax.tick_params(axis='both', which='major')
75        ax.tick_params(axis='both', which='minor')
76        ax.set_ylim(0)
77
78    plt.show()
79
80    return output_vars
81
82if __name__ == "__main__":
83    parser = argparse.ArgumentParser()
84    parser.add_argument('-p', '--model-path', type=str, required=True,
85                        help='Path to GOTM-FABM-ERSEM output')
86    args, _ = parser.parse_known_args()
87    model_path = args.model_path
88
89    main(model_path)
